
We are excited to announce that Figures, Appsembler’s lightweight analytics tool for Open edX, is here! We just launched the much-anticipated Figures on Tahoe in our April 2019 release.
Figures Overview
Figures is an open-source application for Open edX users that provides unprecedented visibility into performance metrics for Open edX sites, courses, and learners. These macro- to micro-level views of data make it easy for Appsembler Tahoe admins to measure performance in Open edX.
Figures seeks to bridge the gap between the highly detailed and heavy technical lift of edX Insights and the overly-opaque and manual-overhead-heavy process of pulling CSV files from each individual course’s Instructor Dashboard.
Site Data
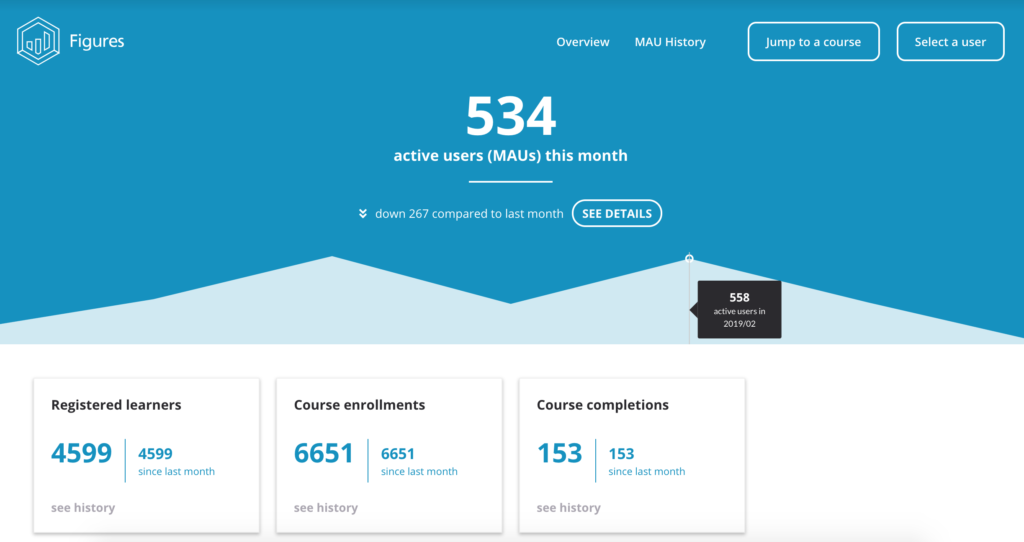
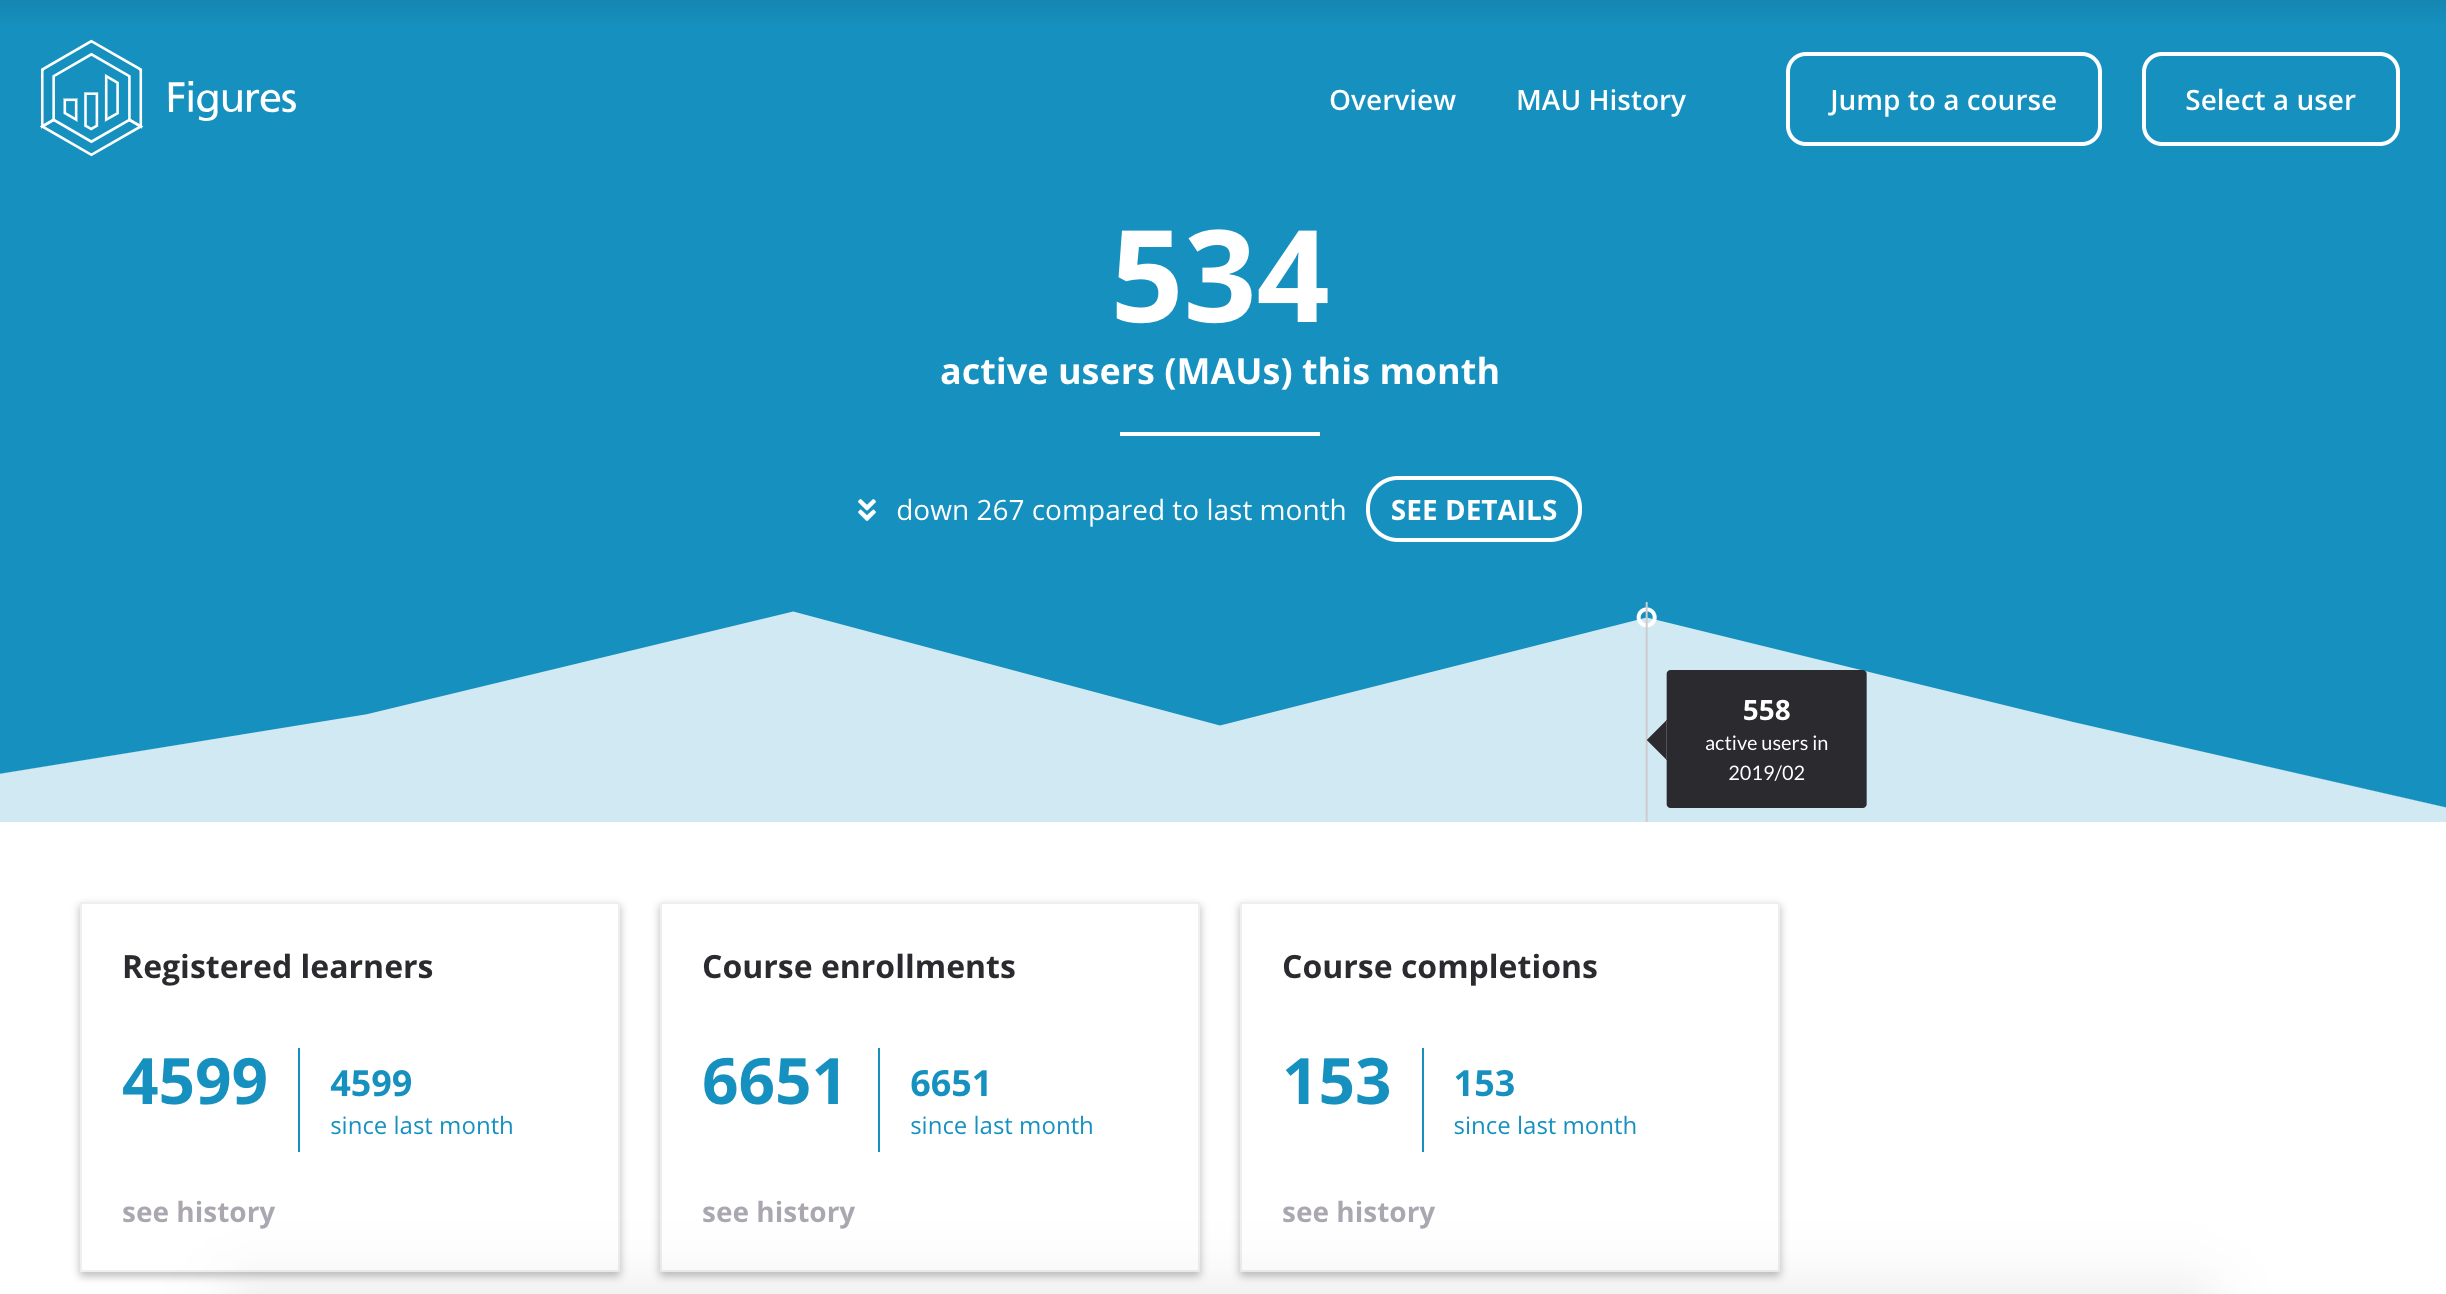
Figures enables Open edX admins to view the number of monthly active users, registered learners, course enrollments, and course completions for any site.
-
Monthly Active Users (MAUs): in a given calendar month, the number of unique learners that have accessed my Open edX site at least once
-
Registered Learners: total users that have created accounts on my Open edX site
-
Total Course Enrollments: total times all registered users have enrolled or been enrolled in courses on your site.
-
Course Completions: total times learners across all course have completed a course
Course Data
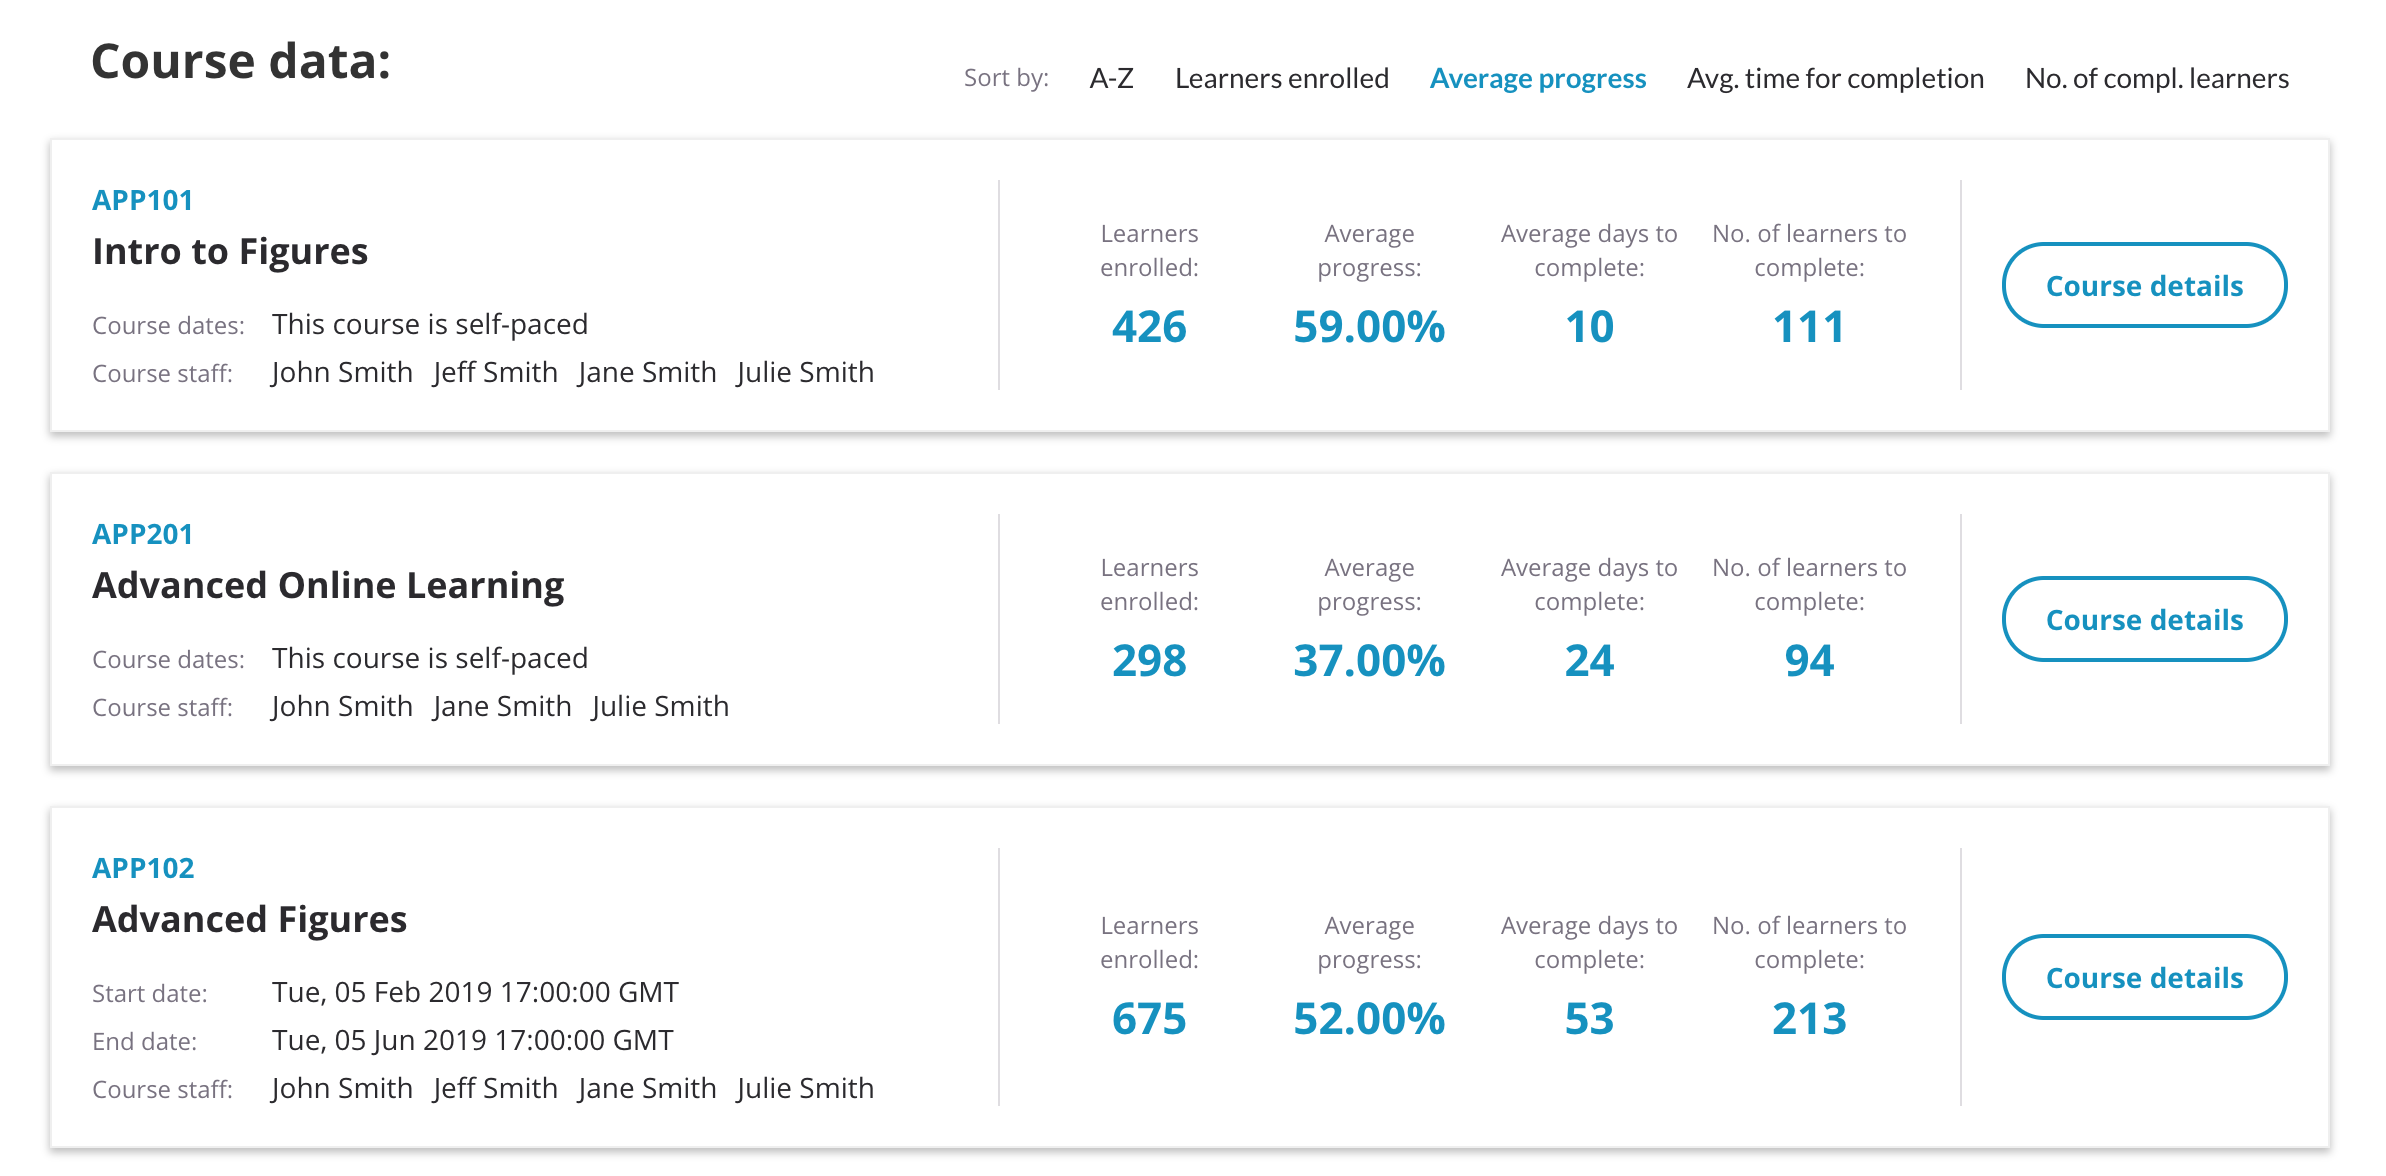
Figures also enables Open edX admins to easily view course information such as course name, number, dates, and staff alongside the following metrics:
- Learners enrolled
- Average progress
- Average days to complete
- Number of learners to complete
- Number of unique learners that have completed the course
For any given course, statistics on self-reported learner data such as gender, country, and education level are also available. Admins can even get a quick snapshot of performance by learner for any course with a view of date enrolled, course progress, and course completion status and date.
Individual Learner Data
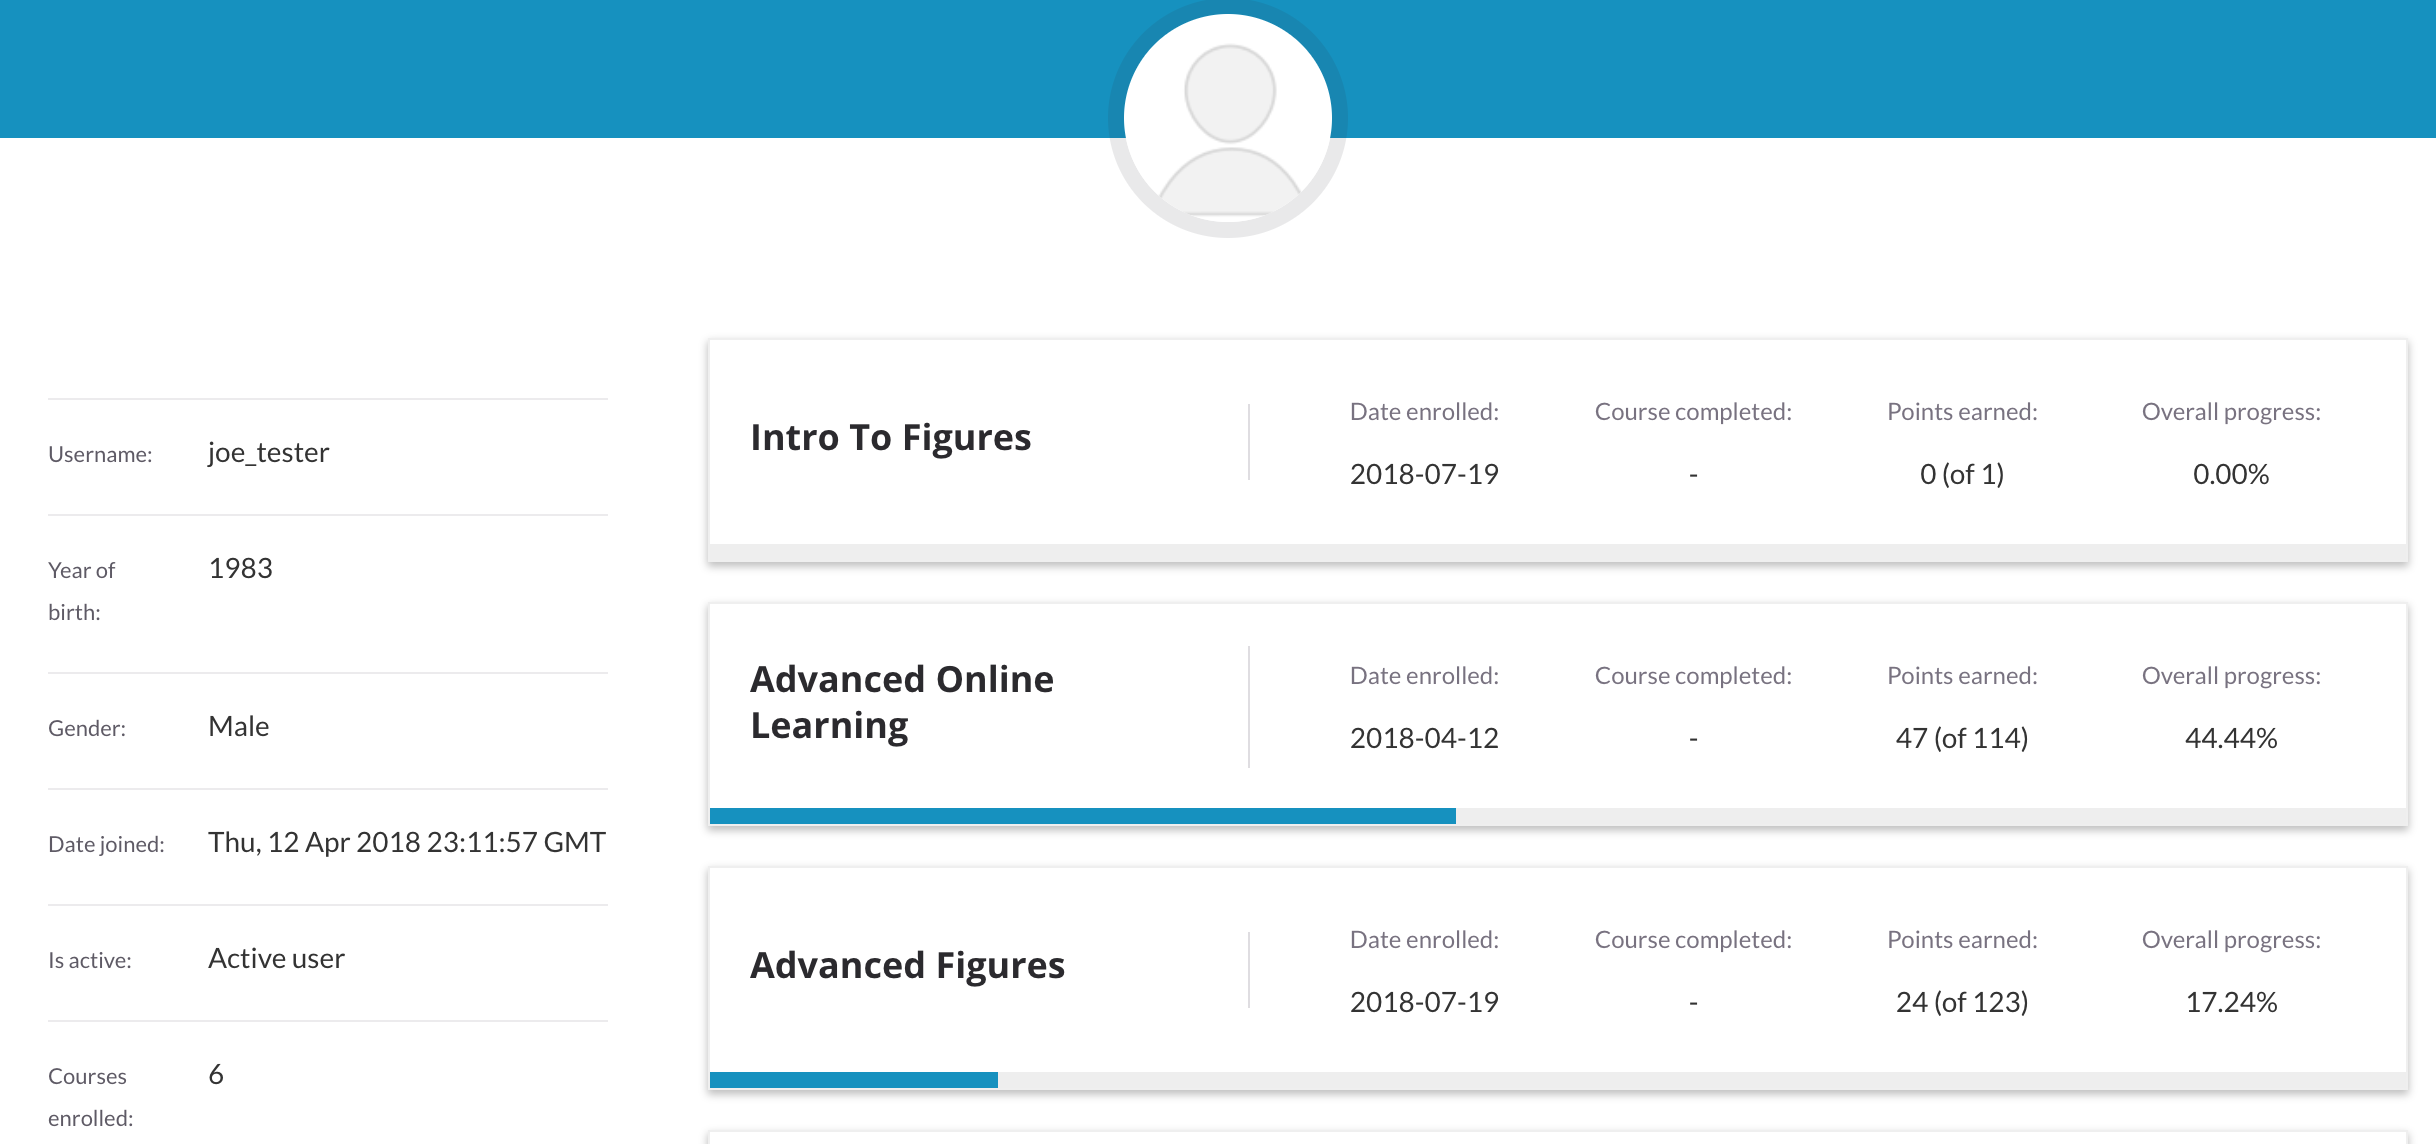
Figures provides micro-level visibility as well as admins can drill down into the data from site to course to individual learner. Here, they can view learner profiles, the courses in which they are enrolled, and their progress and performance within those courses.
Get Started with Figures
Figures truly has the power to make meaningful and measurable impacts anywhere that learner experiences and organizational outcomes intersect.
Want to see Figures in action? Request a live demo with our team.