
As your company grows, it’s important to have an easy-to-use system for monitoring the health of your infrastructure. Ops people need to know when servers are running low on resources; developers need to know when an application-level bug is causing grief for users. At Appsembler, we use a variety of tools to keep an eye on our systems and alert us when something goes wrong.
Infrastructure monitoring with Stackdriver
We run most of our infrastructure on Google Cloud Platform. Google acquired Stackdriver a little over two years ago and rolled out an integrated version of their monitoring tool for GCP and AWS this past March. This kind of integration makes it super simple for us to set up monitoring for new servers. By assigning labels to servers, they are automatically added to monitoring groups with pre-configured alerting policies.
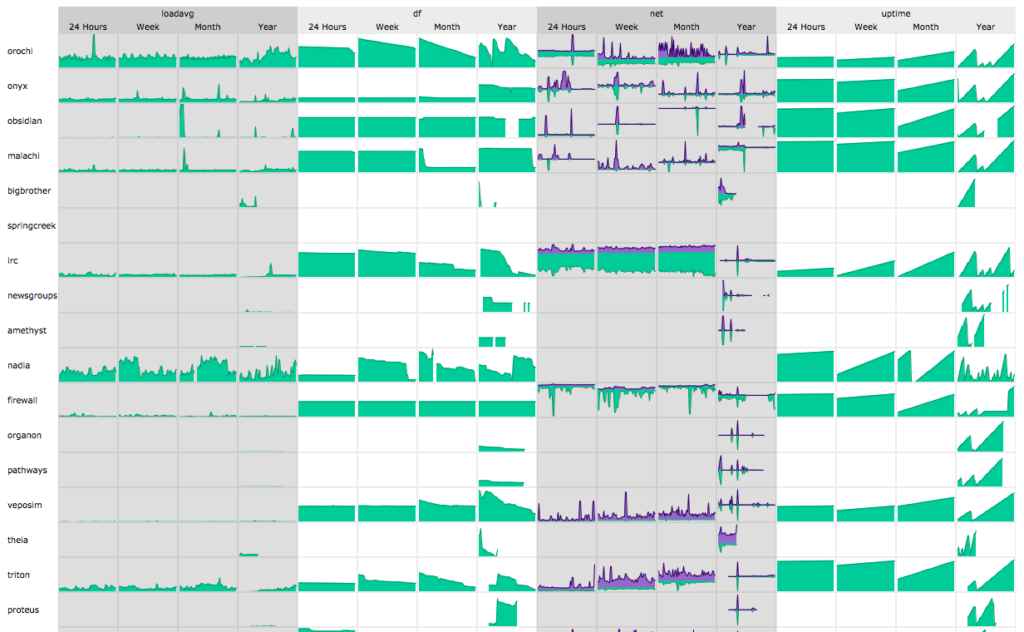
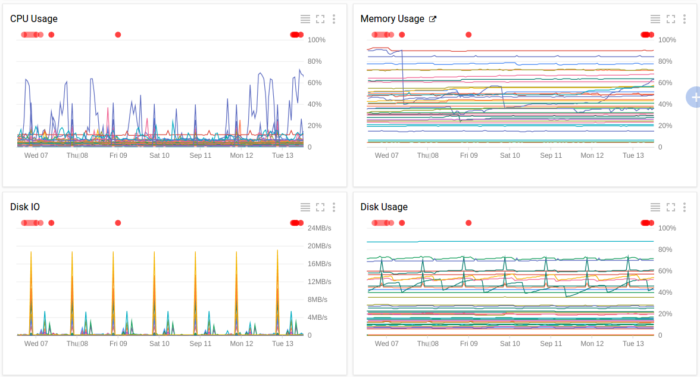
Stackdriver allows us to monitor important server metrics over time, including things like CPU, memory, and disk usage. We can construct dashboards with graphs of our most important metrics, which enables us to quickly spot anomalies and trends in resource usage.
Stackdriver provides a lot of flexibility in setting up alerting policies. We can create a policy that triggers when usage is exceeded for a particular resource and apply it to a specific group of servers. This allows us to have different policies for production and staging environments, or for different projects. In addition to resource monitoring, we also use HTTP uptime checks to let us know if a particular site or URL is down. Uptime checks ping each site from six locations around the world, reducing the potential for false positives.
Catching application errors with Sentry
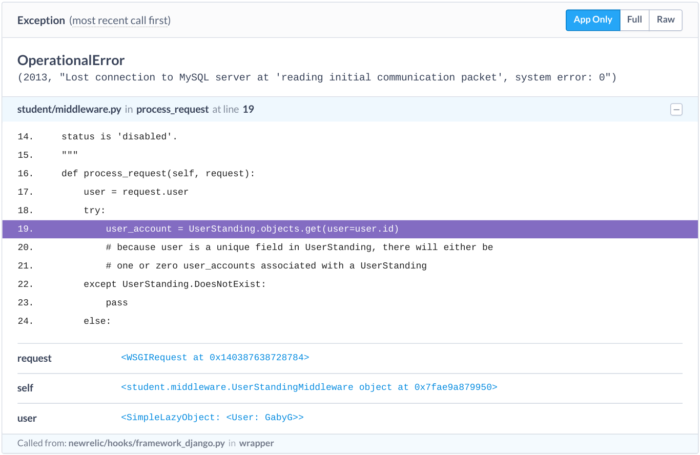
It’s important to know that your servers are in good shape, but unfortunately having healthy servers doesn’t mean that your application is working. To ensure that, we use Sentry. Sentry is a tool that collects uncaught errors along with execution context. So, whenever a user receives an error due to an application bug, Sentry lets us know.
Sentry has been invaluable in helping us fix bugs quickly. Each error that is logged to Sentry comes with a stack trace that includes the values of variables for each stack frame. This lets us see exactly how the program was executing when the error occurred. With this extra context, we can track down the cause of an issue much more quickly.
Collecting it all with ELK
Sometimes application bugs and server issues are too subtle to be detected by tools like Stackdriver and Sentry. In these cases, engineers may have to dig through logs to get to the root of an issue. ELK lets us “collect it all” — application logs, system logs, database logs — and sift through it when an unknown problem arises.
ELK is an acronym for Elasticsearch, Logstash, and Kibana. Logstash aggregates, filters, and parses entries from log files. These entries are then shipped off to Elasticsearch, which indexes and stores them. Kibana is the graphical interface that engineers use to search through logs and create visualizations.
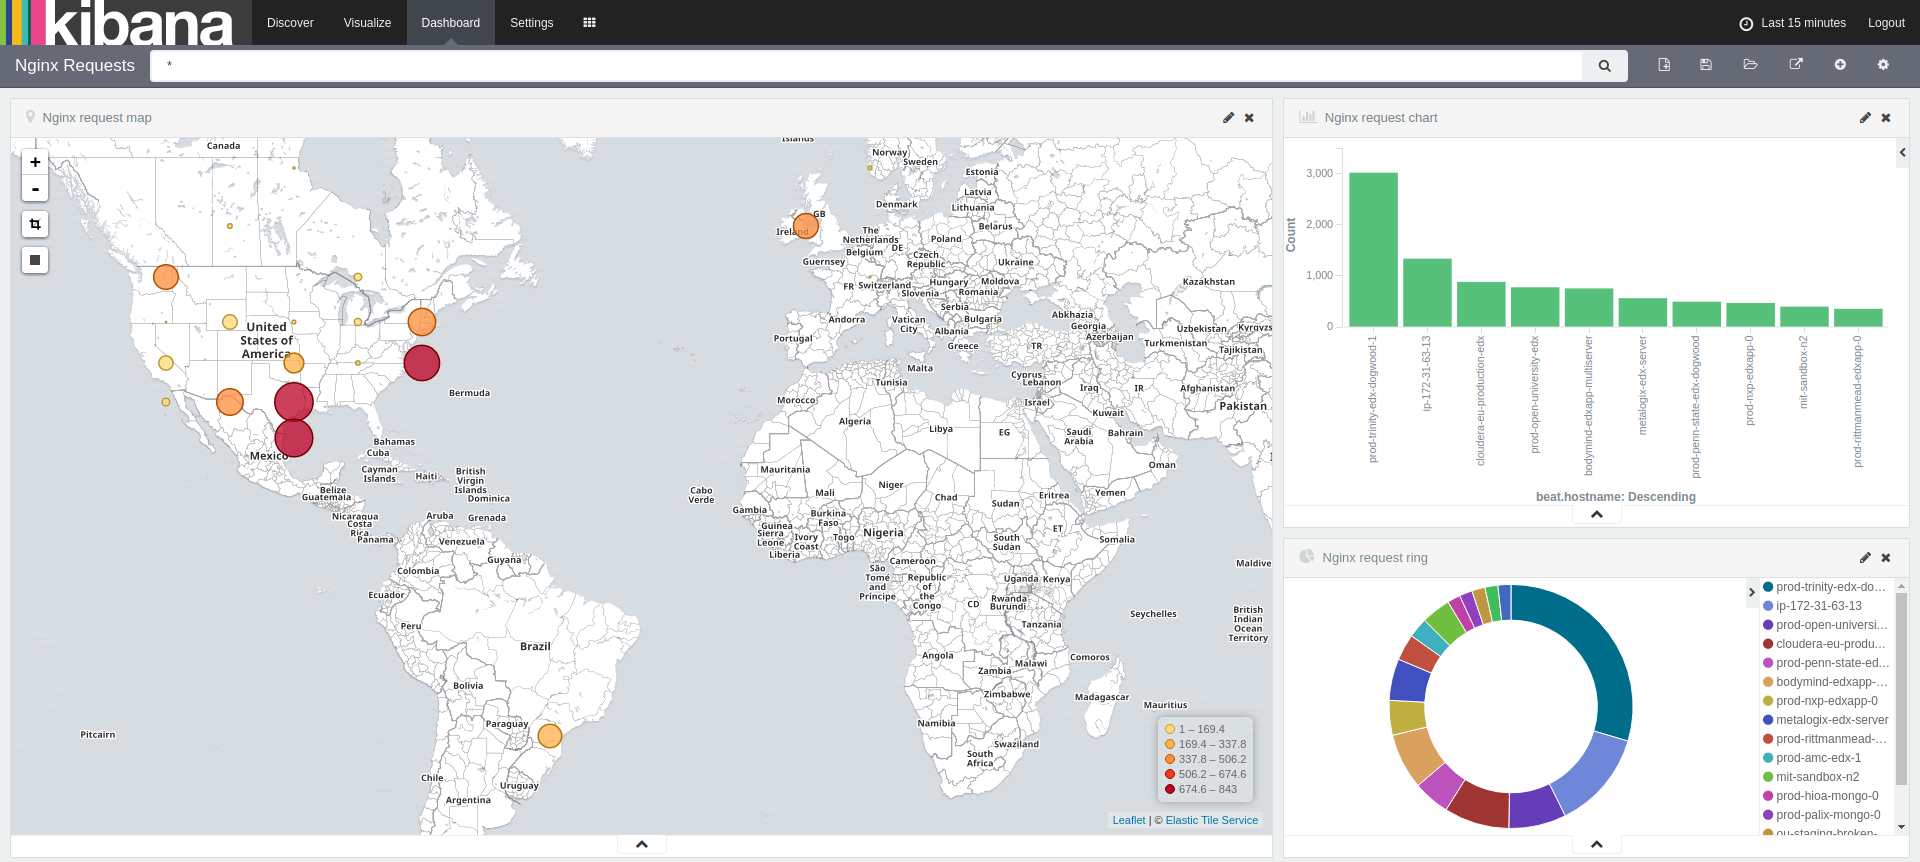
ELK makes for a very powerful logging system. We can parse specific fields out of logs using regular expressions, then filter and search by any of those fields. The ability to slice and dice logs makes it much easier for engineers to find what they’re looking for. Using Kibana’s graphing tools, we can also build dashboards to help us visualize how users are interacting with our systems. The example above shows the origin of web requests by geographic location, as well as the number of requests received by each server.
Getting notified with PagerDuty
When there’s an urgent issue that needs to be addressed, it’s important that it’s not lost amongst the torrent of email and other communications that take place on a daily basis. PagerDuty is a service that allows us to aggregate the alerts from all of our monitoring tools and ensure that the proper alerts get to the right people.
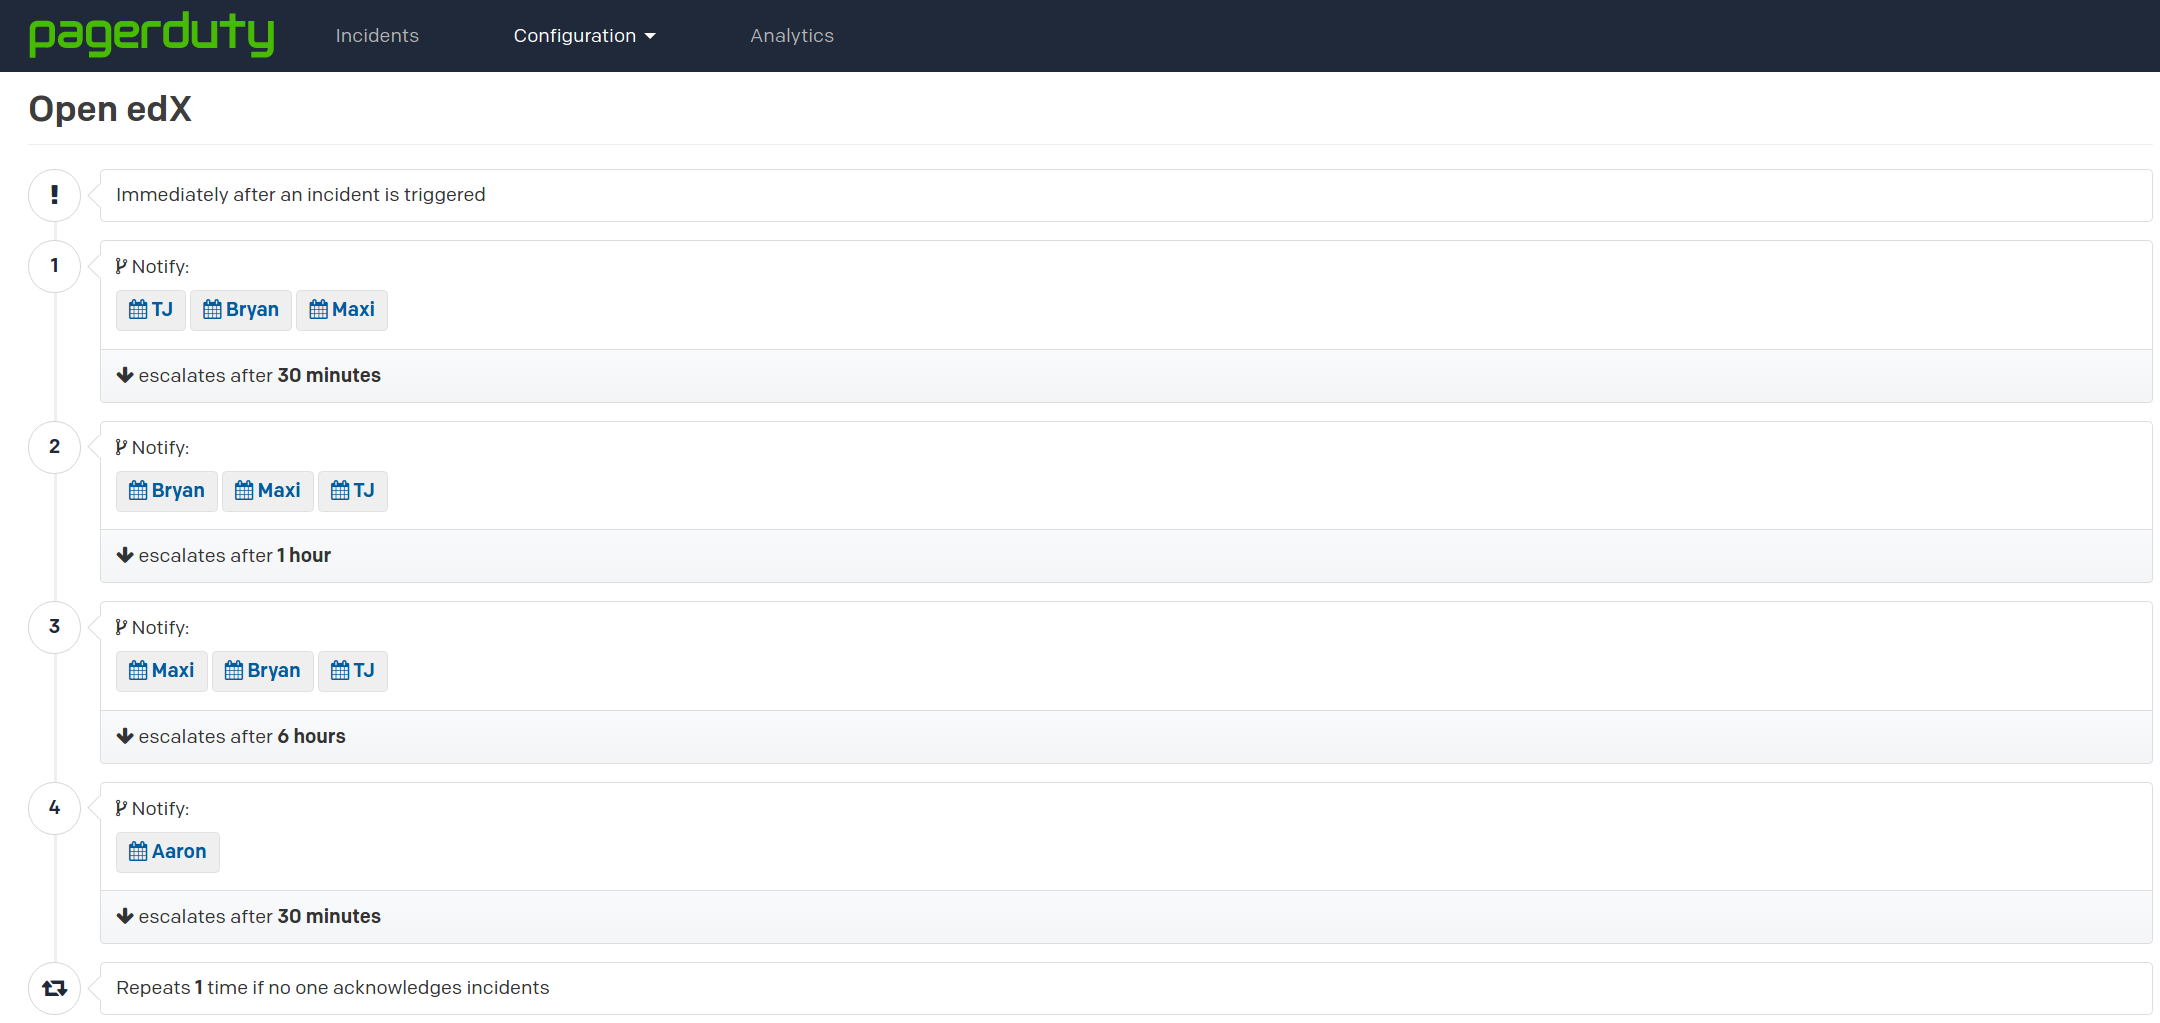
At Appsembler, we have a distributed team working across half a dozen time zones on multiple projects. We have ops people, developers, and managers. Clearly, not everyone should receive every alert at all hours of the day. PagerDuty allows us to create on-call schedules for each member of the team so that no one receives an alert at 4am or while they’re relaxing on vacation. In addition to schedules, we have multiple escalation policies. When an alert comes in, the matching policy alerts a group of people at the first escalation level. If no one is available, the alert is escalated up the chain, ensuring that no issue goes unnoticed.
Conclusion
No matter the complexity of your infrastructure or application, it’s imperative to have robust monitoring solutions in place so that you can address issues before they cause grief for your customers. When it comes to choosing tools, there is no catch-all solution. Each tool has its own specialization, whether it be infrastructure, applications, or logging. Finding the proper mix of tools depends not only on your application, but on your team as well.
Contact Appsembler to learn more. Contact us.