Let’s say that you’ve just launched your first self-paced training course and now you’re trying to understand:
- What are my students doing?
- How are they doing in the class? Which ones have completed the class? Which ones haven’t? Where are they getting stuck?
- Which sections have they completed and which sections haven’t they completed?”
These are the types of questions that our customers are trying to ascertain about the learners as they’re going through their online courses. The good news is that this data is being captured on Appsembler Tahoe, our customer training software based on Open edX.
But it’s not always easy to figure out where this data lives. A question that often comes up is, “How do I access this data? How can I get these insights into what my learners are doing inside these courses?”.
So I want to talk about the four ways that we can expose this data to you, your instructors, your course authors, and even your students, should you choose to share this data with them. There are 3 tools that we expose for viewing and analyzing data:
- Instructor dashboard
- Figures reporting
- Business Intelligence (BI) Connector
Instructor dashboard
At its core, Tahoe leverages Open edX, the open source online learning platform. And the Open edX platform ships with what’s called the instructor dashboard. This is where the instructor can go see what students are doing, who is enrolled, what grades are they receiving in the course, and a whole host of other data that can be downloaded as CSV files.
There’s also a student progress page that will show you all the students who are enrolled in your class and which graded assignments they’ve completed and which ones they haven’t and what their grades were in each of those assignments.
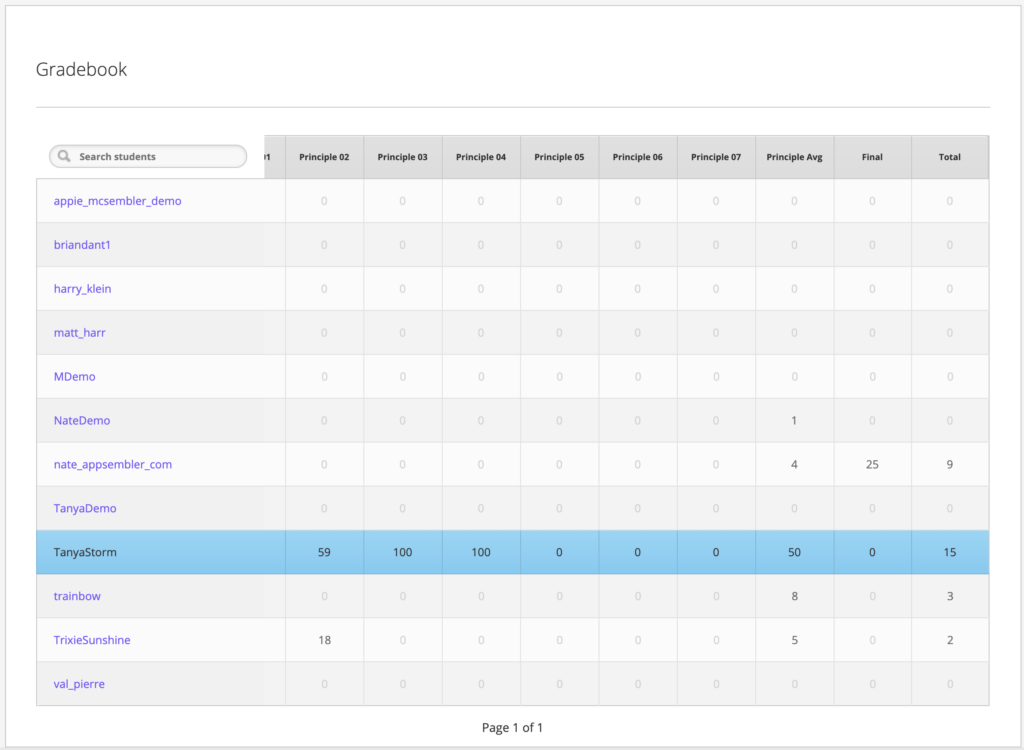
Just as with the instructor dashboard, you can get a lot of information both visually on the page as well as downloadable CSV. What we found is that while there’s a lot of data there, it’s not particularly easy to consume and see at a glance. And there’s a bit of work that the person who has to do on the backend to visualize that data and to glean insights from it.
Figures – lightweight reporting app
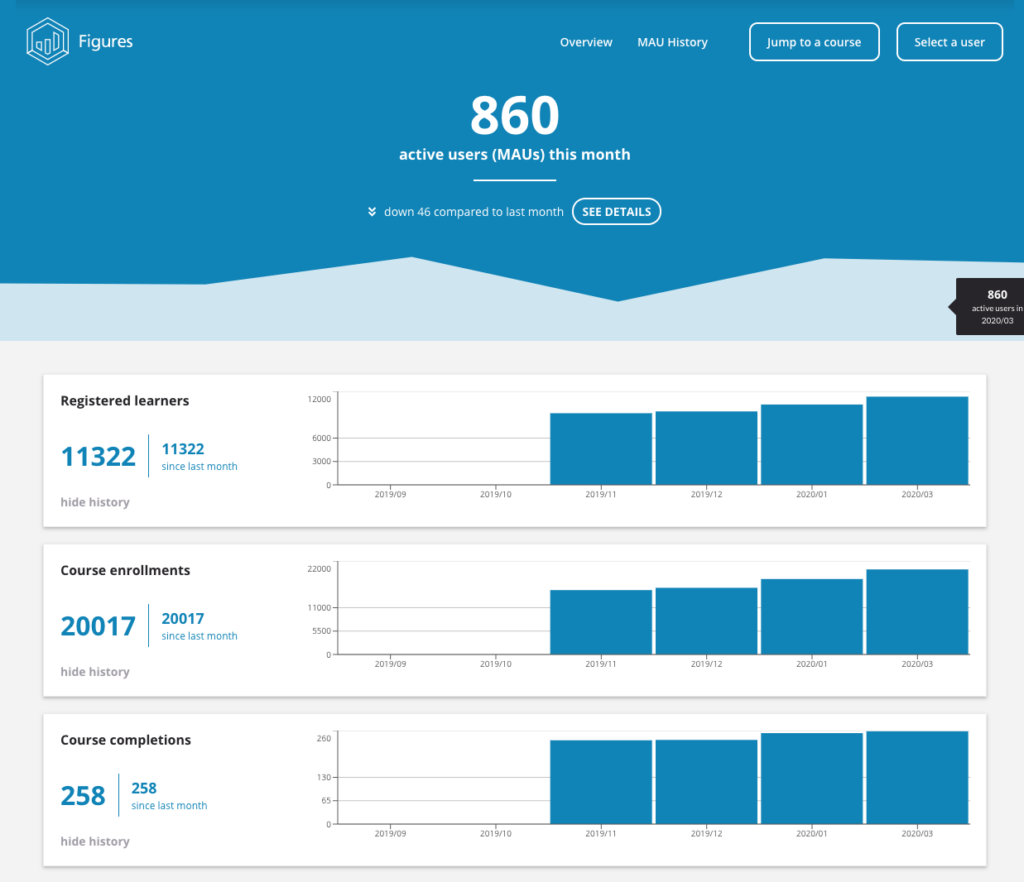
So here at Appsembler we decided to improve this by building Figures which is a lightweight reporting application that sits on top of Open edX, looks at all of the data that is being captured about the students and presents this data in a visually compelling way in the form of graphs and charts. There is also just the raw data is available in table form. And soon we’ll also be exposing this data as CSV downloads, so you can also look at this data in your tool of choice.
Business Intelligence (BI) Connector
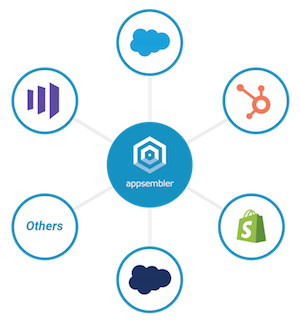
The third way is using what we call the BI Connector (BI stands for “business intelligence”). This is perhaps the most powerful of the three methods and the reason is because the BI connector sends real time events about your students’ activities in your courses to a multitude of different destinations.
These destinations can be a business application like Salesforce or Marketo or HubSpot or MailChimp, but it could also be a database or a data warehouse.

The types of events that can get sent are basically activities that the student does inside the course which can be captured and sent in real time. So you can imagine this opens up a whole host of different opportunities for you as an instructor or course author.
I want to talk about a few of those use cases of how our customers are using the BI connector to offer a better learning experience to gain more insights into how learners are performing and also to drive engagement and completion.
Improve engagement and course completion rates
You may have many learners who start a course and then for whatever reason they get distracted, they get busy with other activities and they forget that they enroll in the course. These learners might just need a reminder.
One of our customers has built a workflow whereby after a student enrolls in a course, an enrollment event gets fired off and is sent to Marketo. Marketo is a marketing automation platform that you can use to send out marketing emails.
In this case, our customer is using Marketo to send out emails to learners. So they basically have delegated to Marketo the reminder emails that gets sent out when a learner enrolls in a new course but then forgets to login to continue the course.
The advantages of using something like Marketo is that you can see open rates and click rates. Marketo can also send out timed emails that are based on the duration of time that has elapsed after the learner has enrolled in the course, or completed the course. Maybe you want to send out an email right away or maybe you want to wait a few days. That can all be automated with Marketo.
This is really where the BI Connector shines in that you can send events from Tahoe into Marketo about your learners activities. This can be really basic activities like enrollment, registration and completion of the course.
But it could also be more granular activities such as participation in a discussion forum or completion of an exam or completing a lab section of the course. All of these activities can be tracked and events are sent to Marketo which in turn, can trigger an email campaign to send a note of congratulations and encouragement to one or more learners.
Trigger homework reminder emails
One of our customers sends out homework reminders every Sunday night, reminding learners that their homework is due on Tuesday. And this email gets a 70-80% open rate! This is a highly valuable email, because it reminds learners that they have committed to learning a new skill. And unlike many marketing emails which are useless, the homework reminders are really useful because they encourage certain desirable behaviors.
The result of doing this is that you’re able to drive higher engagement, learners are getting reminders and this helps them to remember where they left off. It provides much-needed and timely encouragement and essentially helps learners to complete the course.
Encourage continuous learning and mastery in a learning path
Another thing you can do is when a learner completes a course, it can send an event completion event and that can trigger an email that gets sent out saying, “Hey, you just completed this course. How would you like to enroll in the next course in the sequence or in the learning path?”
Analytics and Customized Reporting
Another use case for the BI Connector is analytics and reporting. You can configure the BI Connector to send every event that the learner does inside the online training software to a database. Which means that you can query that database and you can pull out all sorts of interesting reports:
- How long are students taking to complete certain exercises?
- What countries those learners are coming from?
- How many students are enrolling in your course?
- Which learners are participating in the discussion forums?
- What other activities is the learner doing?
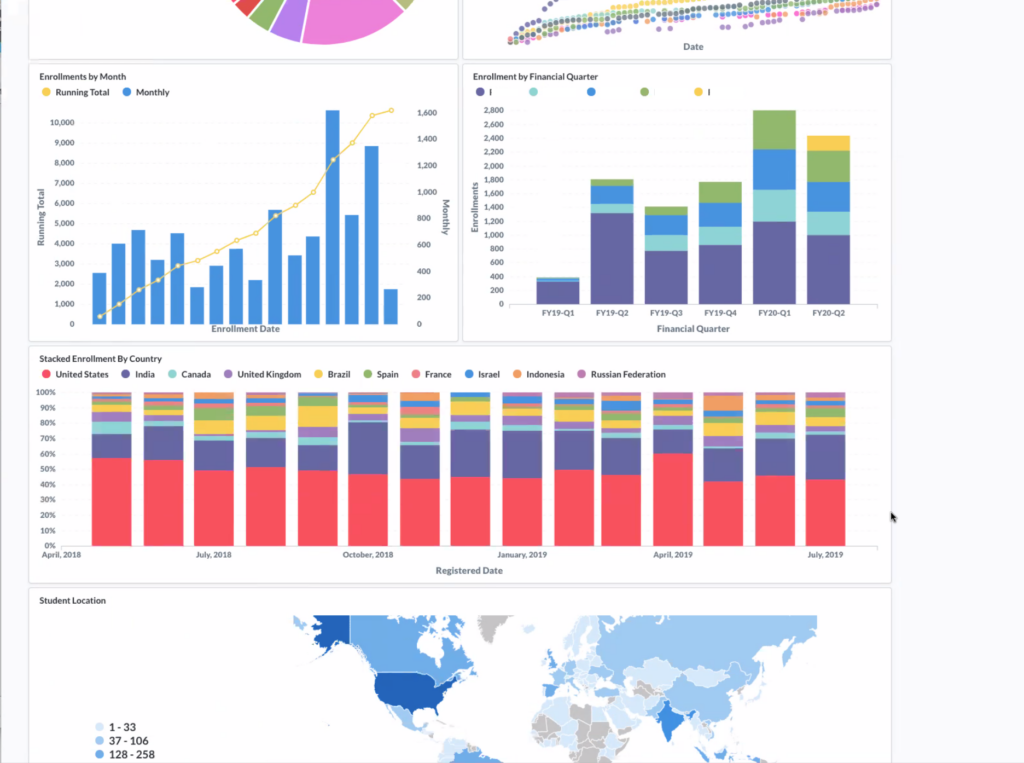
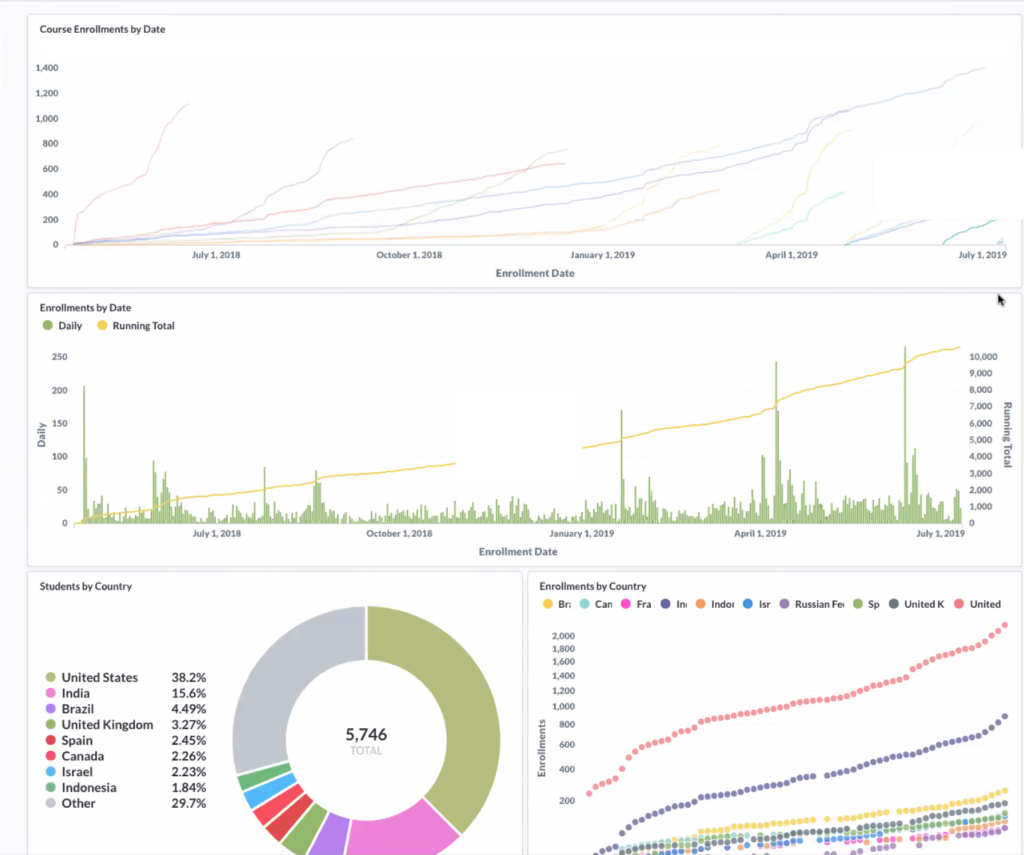
Those are just two examples of the BI connector: driving learner engagement through triggered email campaigns using marketing automation tools, and gaining insights from analyzing student activity data that gets sent to a database or a data warehouse. With this data at your fingertips, there are many more workflows you can enable with the BI connector.
APIs
The fourth way that you can get out the data about your students is using our newly published APIs: the User API, Course API, Registration API and Enrollment API. The Enrollment API can be used not only to enroll the learner but also to get a list of all the learners who enrolled in a particular course. The User API can get you information about your users.
So using these two APIs allows you to generate enrollment reports augmented with additional information about your users. Over time we’ll be adding additional API such as the Progress API, which will allow you to determine which learners are falling behind in the course. With the Progress API, you can look at the data about your learners and use that data to drive engagement and better understand how you can improve your courses and your curriculum.
Join learner analytics data with business data
This data can then be synthesized and joined with business data that you might have sitting in another database. Maybe you use Salesforce to track all of your customers and who is enrolled in your training and who hasn’t. Completion data enrollment data can then be overlaid on top of sales data, upsell revenue and other business metrics that are really important to your business.
In this way, the L&D department or marketing department or even a sales department can show how education and training really moves the needle on driving new sales, driving product adoption, driving upsells, improving overall customer satisfaction with your product or your service.
In conclusion, we’re really excited to be bringing these different data sources to you and we’re excited to hear what other use cases you have, and how we can help you achieve your business objective with Tahoe, Appsembler’s customer training software based on Open edX.

